Check these 4 things before you share your experiment's results with your team
I’ve made my share of analysis mistakes, some costing weeks of team members working on the wrong thing, or worse - missing a great opportunity. But through that I’ve collected a mental checklist of what are the common pitfalls in analysis, whether of experiments (A/B tests) or observational data (just looking at logs, like # of users or conversion rates).
If you test for these, or just caveat what you didn’t test for you can be more prepared for executive questions and make sure the actions people take based on your analysis aren’t tainted by an incorrect conclusion. You can use Radical to leave notes next to the dashboard, notebook or chart about what you checked for, or involve your team in commenting, offering alternative hypotheses, etc.
The checklist:
1. Heterogeneous treatment effects
That mouthful basically means you see an effect that is an average of different effects for different populations of users. For example, maybe the new version of your website is much better at converting men than women: The conversion rate for males is 23% higher than it used to be, while it is slightly worse (-2%) for females. But if your website’s audience is made of 80% women, you will think the new version was a good idea: The average conversion rate is up 3%. In reality, most of your users like it slightly less, and it is only better for a small segment of users.
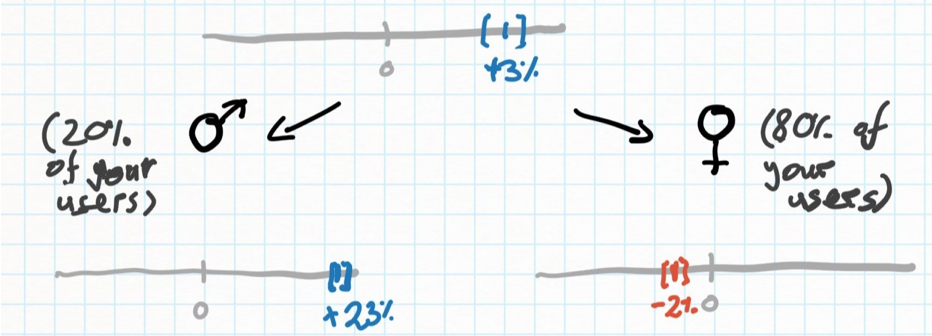
Few users very happy + most users slightly sad might look like a good result
To avoid this, there is often no way but to try segmenting your users by whatever data you have (e.g demographics, geography, etc) and looking for major differences in effect size between groups. However, if you overdo this, you need to be careful of multiple comparisons (essentially, discovering non-existing effects by random). Yeah, I know - 🤷 - no free lunch in Statistics! In some cases though, you can test for this more directly by plotting the distribution of effects: What % of users has what effect on their habits. For instance, when measuring a repeat activity like “Average number of days the user visits your service in a month”, you can check whether an experiment shifted everyone up by 3% (Orange line) or whether there was an average effect of +3% but a wide distribution of actual effects, with some users hurt by the change (Purple). Then, try and figure out what differentiates these users.
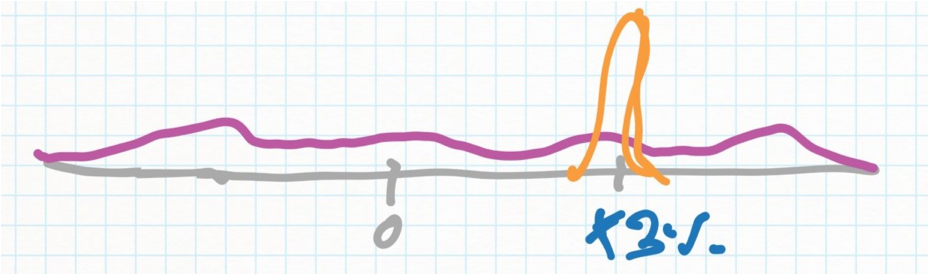
Orange experiment had the same effect for everyone; Purple experiment had a range of effects
2. Mix shifts
A related issue I check for is when plotting data over time. One of the worse errors is an incorrect trend: If the data is “directionally” correct but wrong by a constant (so, you think something’s up when it’s up, just not as up as you think), that’s usually okay for most business decisions. But when you think something is down when it’s up, you might turn off a successful activity or lean into a harmful one! Mix shifts occur when there is both a heterogenous effect (so two or more groups have different outcomes, e.g retention rates) and over time one group is growing as a proportion of the total. This creates a false trend over time coming in from the shift in the populations rather than the shift in behaviour. In the example above, if your website started churning its women users (who’ve had a worse experience after the change you made), you’d think the overall conversion rate is improving — when really it’s just the remaining men who are converting better, but not an overall improvement in the success of the business.
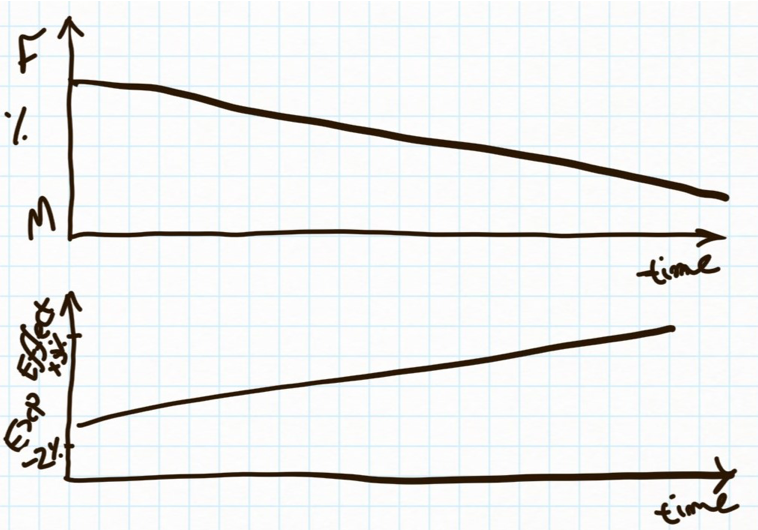
A change in populations from F to M might make the same experiment look like it’s improving
3. Checking exposure
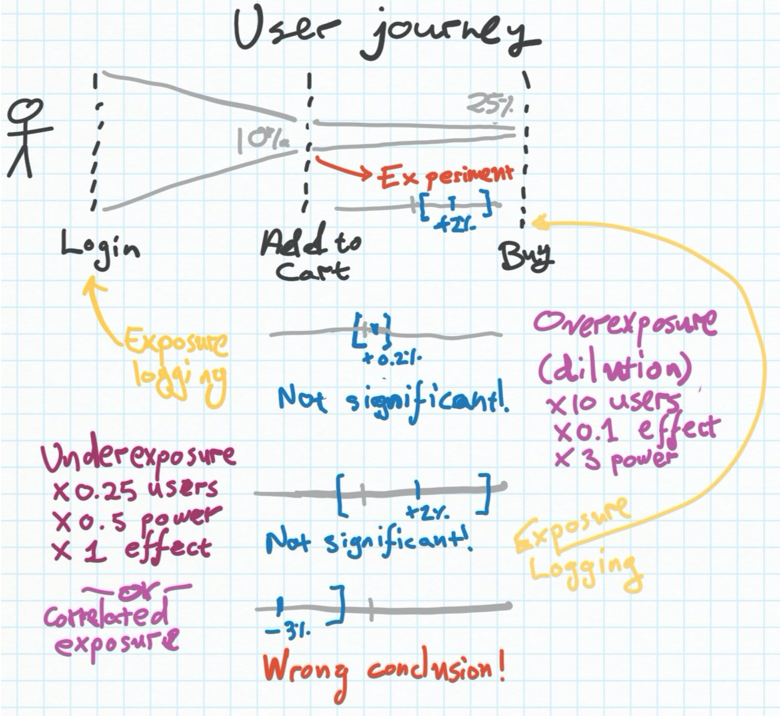
A very subtle topic but a reality of online experimentation is that sometimes we separate out when we log a person was randomized into an experimental group, and when their actual experience changes. Here’s an example: On my e-commerce website, I might have an experiment where half the users who log-in will receive a 10% discount upon checkout, and half won’t. Naively, I may divide the user population into the two experimental groups, A and B, the minute they entered the website, and log this in our database. Then, I run an analysis about which groups, A or B, had a higher checkout rate, and compute the power of the experiment - essentially making sure I had enough users go through the experiment to draw a statistically significant conclusion about its effect. Right?
Well, almost. The thing is, I logged which experimental group users were on when they first visit the website. But a large portion of them (say, 90%), don’t even end up buying anything. So they actually don’t see the coupon — they have the exact same experience as the control group that didn’t get a coupon at all. As a result, of course, their buying behaviour doesn’t change. But the math behind computing the power of the experiment is misleading here: We’re diluting the effect of the experiment with a lot of people who didn’t buy regardless of the coupon, so we end up thinking the experiment was ineffective, or not get to our desired level of statistical significance, and ditch it. This is called ‘overexposure’ - you’re registering people into the experiment who didn’t actually get the treatment.
Over-exposure and under-exposure both make experiments look not stat. sig. when they are
In the rarer, converse case we might be exposing the user before logging he was on an experimental group - this could happen in complex setups where e.g we only logged the exposure when they actually checked out, not when they first saw the coupon in their cart - and as a result we underexpose and also dilute the effect of our experiment (or worse, can make the wrong conclusion if the exposure is correlated with some behaviour).
The bottom line is to always make sure you are clear on where did the user first encounter any possible effect of the experiment, and logging their inclusion in an experimental group (or control) only then.
4. Multiple comparison
Statistical power is a complicated topic, and it’s well known we can incorrectly discover an effect (as Randal Monroe of XKCD so well put in an experiment testing for the link between different coloured jelly beans and acne). But we can also miss an effect that’s there because our experiment is underpowered (So for example, it’s extremely hard to discover something you did improved conversion rates by 0.1%, because that requires tens of thousands of users). And while a 0.1% improvement is not in general critical for the success of the business and we shouldn’t focus on it, 0.1% degradations happen all the time, and are hard to catch. Here’s an example. Imagine we’re in a growth team doing various experiments on the experience in our app, and many of these happen to have great outcomes on our daily active users.
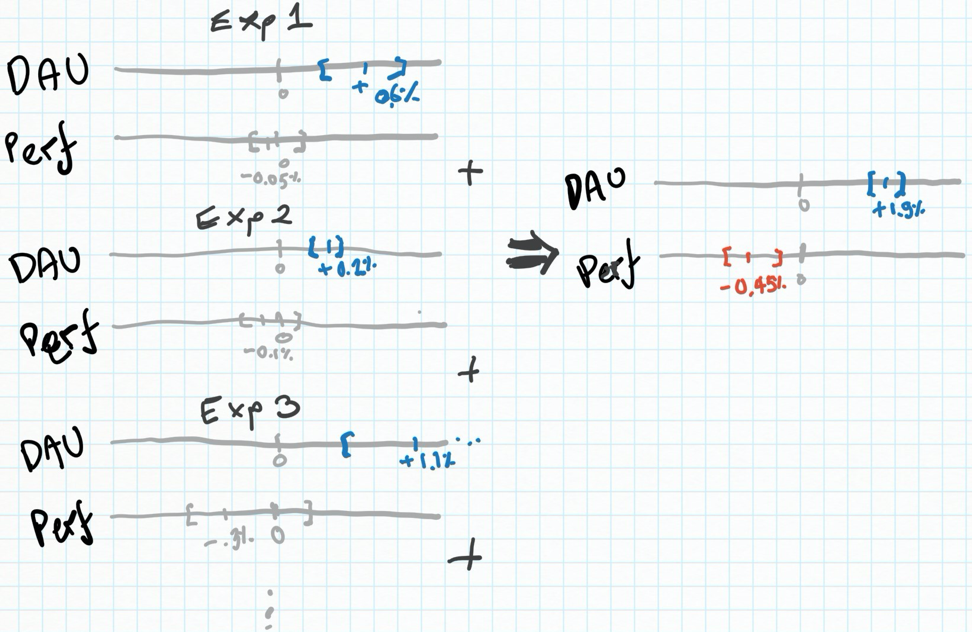
But, we’re not silly - we also check for effects on long term retention. If an experiment had a statistically significant negative effect on retention, we would reject it. However, long term retention is a noisy metric with less users and less power to measure it on, and the effects are often subtler. They often pan out slightly negative or slightly positive on average, but with confidence intervals that mean they are statistically insignifcant: We can’t be certain they’re negative. What happens though, is that many of them might. We might be unknowingly accruing small, negative effects to retention. Hence, ‘death by a thousand (statistically insignificant) cuts’ (coined by a fellow Facebook analytics genius).
In each experiment separately, the effect to performance is slightly negative but not stat. sig. Taken together though, this is clearly harmful
The main way to protect against this is with a long term holdout. A long-term holdout is a set of users who don’t receive any new experiments even as these are rolled out to the rest of the user population. You can then measure the effect of all the other experiments taken together on the long-term holdout and see whether the other users’ experience diverged significantly from the holdout — essentially the holdout is a control for the effect of many experiments together.